Debugging PHP with PDT and XDebug
This post is for PHP developers currently not using a proper PHP debugger.
Installation and configuration of PDT (PHP Development Tools for Eclipse) with the excellent XDebug debugger is discussed in a step-by-step fashion. Please note that my intention is to allow a beginner to get up and running quickly. So my apologies for not discussing all aspect of the procedure in detail. I must also warn you that there could be other (possibly better) ways of getting the same thing done.
සිංහල ලිපියක් ද හැකි ඉක්මනින් පලකරන්නම්.
Check PHP version and file locations
- Create a PHP file (say info.php) with the following code:
<? phpinfo(); ?> - Open it using a web browser.
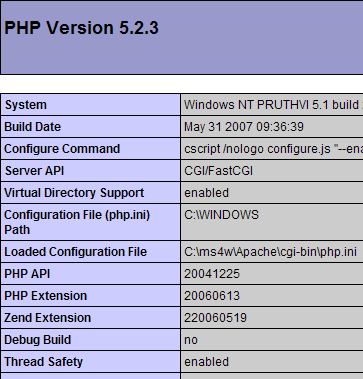
According to this:
- PHP 5.2.3 is installed. It is not a debug build and thread safety is enabled.
- The location of the php.ini file is given as
C:\ms4w\Apache\cgi-bin\php.ini - The PHP extensions directory is given as:
C:\ms4w\Apache\php\ext
Note these settings for your installation of PHP.
Configure PHP to use XDebug
- Go to http://www.xdebug.org and download the correct windows module for your PHP version.
In my case,php_xdebug-2.0.2-5.2.5.dllwas used. - Copy the XDebug dll file to the PHP extensions directory.
- Add the following at the end of the php.ini file. Just to be on the safe-side, make a backup of this php.ini file.
[xdebug]

xdebug.remote_enable=1

xdebug.remote_host="localhost"

xdebug.remote_port=9000

xdebug.remote_handler="dbgp"

zend_extension_ts="C:\ms4w\Apache\php\ext\php_xdebug-2.0.2-5.2.5.dll"
- In
php.ini, find the implicit_flush directive and the output_buffering directive and set it as follows:
implicit_flush = On

output_buffering = 0
Warning: this will seriously degrade performance so should be done only on the development server.
Notes
xdebug.remote_hostis where your debugger client will run.
You will need to change the path and file name of the xdebug dll file to match your environment.
Restart Apache server.
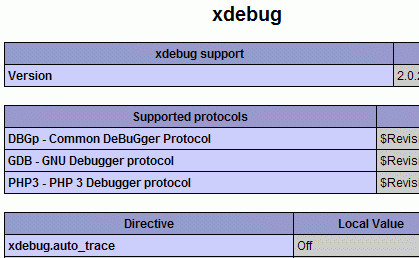
Open/refresh the info.php file from the web browser and verify that XDebug is installed correctly.
There should be an entry right-next the Zend logo …

… and a detailed XDebug configuration section further down the page.
Install PDT
- Download the all-in-one PDT bundle from http://www.eclipse.org/pdt/
It comes as a zip file named pdt-all-in-one-1.0-R20070917-win32.zip - Extract the zip file to C:\
- Execute C:\eclipse\eclipse.exe
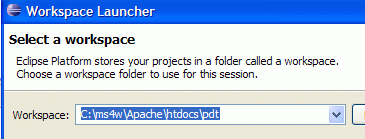
- Select a workspace- this is where your projects will reside.
Select the parent directory of where your web directories will be placed.
Create a PHP project
- File — > New — > Project … — > PHP — > PHP Project
- Select prj1 for project name and click Finish.
- Right clicking on the project folder of the PHP Explorer, and select New — > PHP file.
- Enter some PHP code. e.g.
<?php

for($i=1; $i<6; $i++){

echo $i . "<br />";

}

?>
Configure PDT as a XDebug client
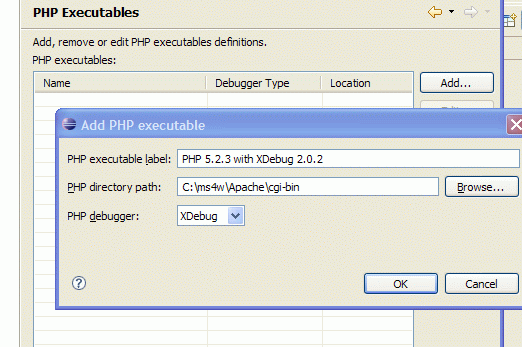
Define a PHP executable: Window — > Preferences — > PHP — > PHP Executables — > New
Define the settings for a PHP Web Server: Window — > Preferences — > PHP — > PHP Servers
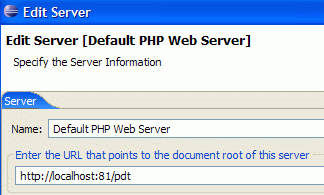
Notice that we define the root of the server to be our workspace directory.
Define debug settings: Window — > Preferences — > PHP — > Debug
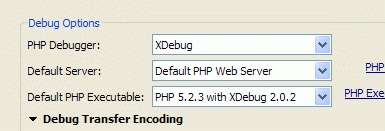
Go to Window — > Preferences — > General — > Web Browser
Select to use an external web browser.
To debug a PHP web application
Select: Run — > Open Debug Dialog …
Right click on “PHP Web Page” in the list on left-hand side and select “New …”
Select settings as below:
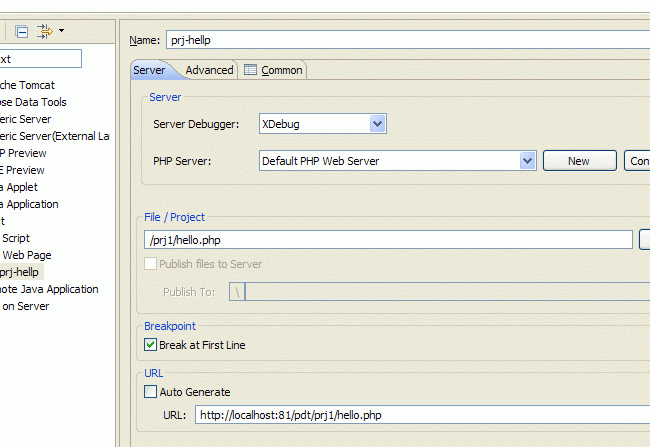
You will have to type in prj1 part in URL.
Select “Apply” and then click “Debug”.
That’s it.
To debug a PHP Script
Just right-click file and select Debug As … — > PHP Script
That’s it.
Reference
For more details on using XDebug with PDT refer to the XDebug Guide.

Hi
I found this very helpful and got it working. I was wondering do you also have smiliar tutorual of subeclipse?
Regards
Nik
Hello,
Please, apologize me for my (very) poor english
You use php by cgi.
What are the setup of pdt when isapi are used ?
Thanks by advance.
Sorry. I haven’t used PHP with IIS.
😦
[…] mentioning it because it’s hard to make it work with Eclipse. Thanks to the great blog post Debugging PHP with PDT and XDebug it is now easy to have debugging environment for your PHP projects. « Peter Hacker […]
Thanks for that article, got me running on IIS with no problem. Now I just have to learn PHP and I’m done!
Thanks,
Dan
http://www.DVDs4theSAT.com
Great SAT prep in a 12 DVD set
Here’s a detailed step-by-step article for setting up a PHP debugger using PDT+XDebug and XAMPP:
http://robsnotebook.com/php_debugger_pdt_xdebug
Nice quick article, was up and running in no time. I was setting this up on a friends computer and the quote used by your font in the code below caused my php.ini file not to work. If anyone else has this problem, be sure to replace [ ” ] character with a normal [ ” ] characters
[xdebug]
xdebug.remote_enable=1
xdebug.remote_host=”localhost”
xdebug.remote_port=9000
xdebug.remote_handler=”dbgp”
zend_extension_ts=”C:\ms4w\Apache\php\ext\php_xdebug-2.0.2-5.2.5.dll”
Thank you. Worked great.
You should make one adjustment, under Eclipse 3.4 the debug options are in: Run -> Debug Configurations, but this should be logical.
Thanks again.
If you use PHP 5.3 and can’t get XDebug appear in your phpinfo():
“From PHP 5.3 onwards, you always need to use zend_extension and not zend_extension_ts.”
See http://www.xdebug.org/docs/install
Hi,
I’ve installed Eclipse with XDebug Under Xampp following your tutorial but when it comes to define the PHP Executables I got stuck , I do not know Where / How to get them !?
many thanks
Fantastic! I’d been using the ‘echo’ method of debugging PHP scripts for years. I’ve been doing more and more PHP scripting recently and found the need for an IDE with debugging. PDT + Xdebug + Wamp do an amazing job for me. Thanks for the tutorial!
It’s amazing in support of me to have a web page, which is useful in support of my know-how. thanks admin